Troubleshooting missing or orphan spans
This guide will walk you through the process of identifying missing spans, understanding their root causes, and implementing solutions to ensure your OpenTelemetry setup with Checkly provides complete and accurate tracing information.
Missing spans
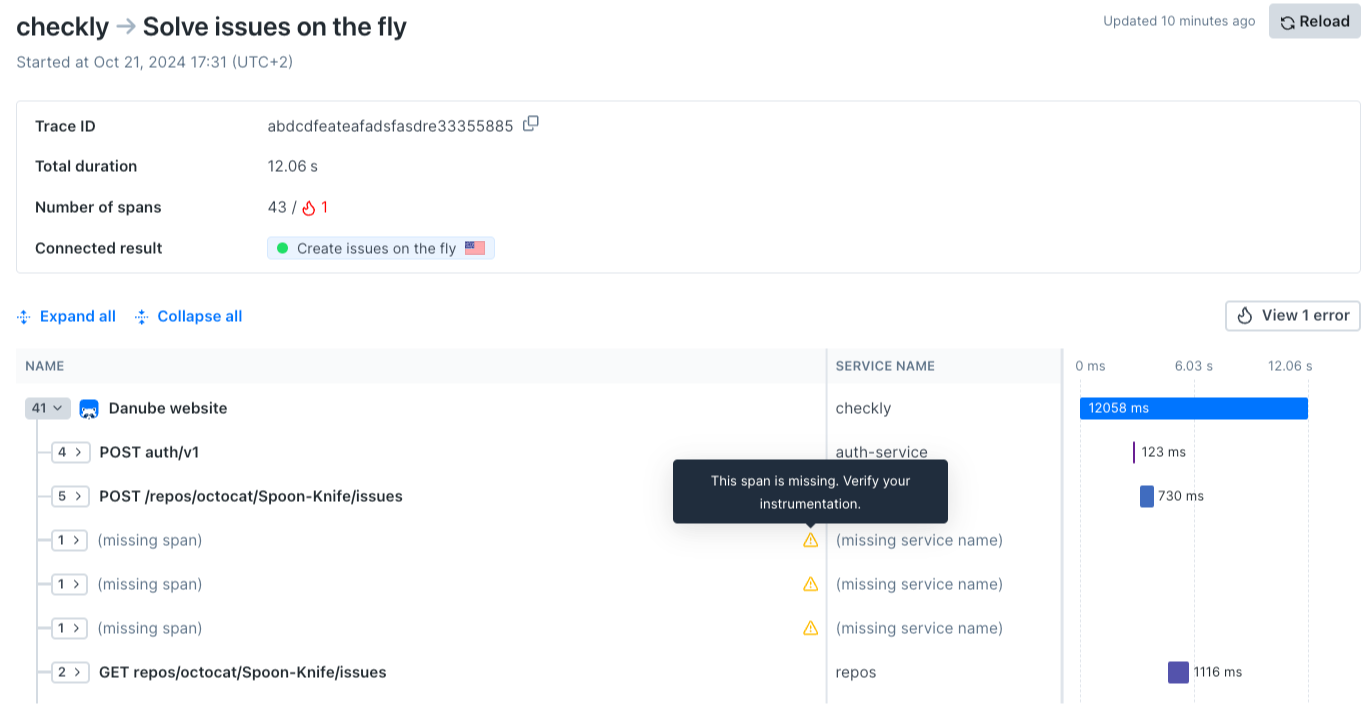
Missing spans, also known as orphan spans, are segments of a trace that are disconnected from either their parent spans or from the root span.
An instrumented distributed system will emit spans, creating a hierarchical chain that follows the flow of the request through the different components and services.
When a span is missing, they create a hole in this chain, making it difficult to diagnose issues and understand the full picture. If this happens, you will notice a span missing from the visualization in Checkly.
Checkly uses contextual span data—such as the trace it belongs to and its parent span—to display any missing pieces in the span chain. This helps you identify which application or service may be incorrectly instrumented.

Troubleshooting missing spans
Missing spans can happen due to various reasons. Whether you’re sending data to Checkly directly from your applications and services, or through the OpenTelemetry Collector, these are steps to confirm everything is properly set up.
Verify sampling strategy
Using Checkly Traces, we recommend sampling for the tracestate header checkly=true, which will reduce your Egress/Ingress costs and ensure that all the spans that were originated through a check are there.
Sampling in the OpenTelemetry Collector
-
Step 1. Make sure that you’re filtering out non-checkly spans:
processors: batch: filter/checkly: error_mode: ignore traces: span: # filter out spans in which tracestate is not "checkly=true" - 'trace_state["checkly"] != "true"' -
Step 2. Confirm that your Collector pipeline uses this processor:
service:
   pipelines:
      traces:
         processors: [filter/checkly, batch]
Sampling directly in your applications’ code.
Choose the specific instrumentation language guide and review your configuration against Step 2 in the guides.
Review OpenTelemetry Exporter configuration
Ensure the right Authorization keys and endpoints are in use.
Exporting through the OpenTelemetry Collector
-
Step 1. Make sure that your exporter uses the right endpoint authorization:
exporters: otlp/checkly: endpoint: "otel.eu-west-1.checklyhq.com:4317" headers: authorization: "${env:CHECKLY_OTEL_API_KEY}" -
Step 2. Confirm that your Collector pipeline uses this exporter:
service:
   pipelines:
      traces:
         exporters: [otlp/checkly]
Exporting directly from your Application’s code
Confirm your environment variables use the correct endpoint and authorization:
OTEL_EXPORTER_OTLP_HEADERS="authorization=<your-api-key>"

OTEL_EXPORTER_OTLP_ENDPOINT="https://otel.eu-west-1.checklyhq.com"
Checkly Private Location setup
When setting up Traces with a Checkly Private Location:
-
Step 1. Ensure your Checkly Agent version is at least 3.3.5.
-
Step 2. Review your internal Firewall rules:
-
Identify the ports used by OpenTelemetry, commonly:
- Port 4317 for gRPC protocol
- Port 4318 for HTTP protocol
-
Access your firewall settings and add rules to allow outgoing traffic on the identified port.
For example, to allow HTTP traces to be sent out:
A OUTPUT -p tcp --dport 4318 -j ACCEPT
-
Incomplete instrumentation
To see the full picture, and identify the root cause of a problem faster, ensure your applications and services are instrumented with the OpenTelemetry SDK.
Last updated on November 6, 2024. You can contribute to this documentation by editing this page on Github